WXvisual Hydromet Web Visualization Software

Station Location Maps
Maps with real-time sensor values and colors based on thresholdsLayers allow the user to view overlays such as Weather Radar, QPF, and Drought

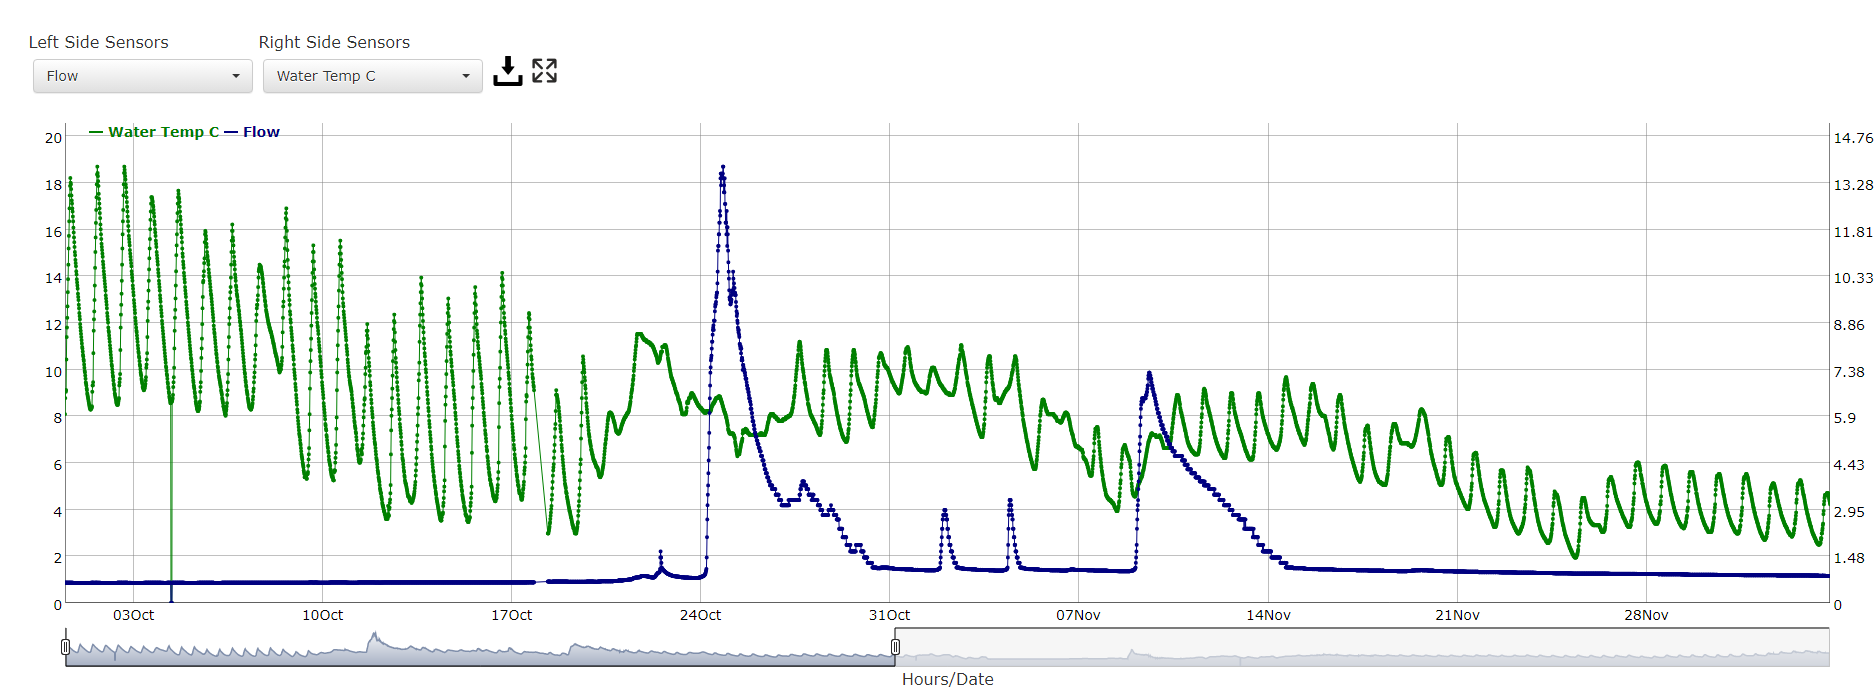
Dynamic Graphs
Single and multiple graphsGraphs can be exported into image files or data files